As of June 7th, 2023, the prime rate has increased by another 0.25% for the second time this year.
2023 Inventory Trends
January 2023 – 3.8 months
February 2023- 2.74
March 2023 – 2.24
April 2023 – 1.9
May 2023 – 1.2
*meaning if no new houses came to market, we would be sold out in 1.2 months
Seller Market = less than 4 months of Inventory
Balanced Market = 4-6 months of inventory
Buyers market = 6+ months of Inventory
Well-priced, well-prepared homes are moving fast right now. Multiple offer situations have returned to certain neighbourhoods and the days on market have gone back down.
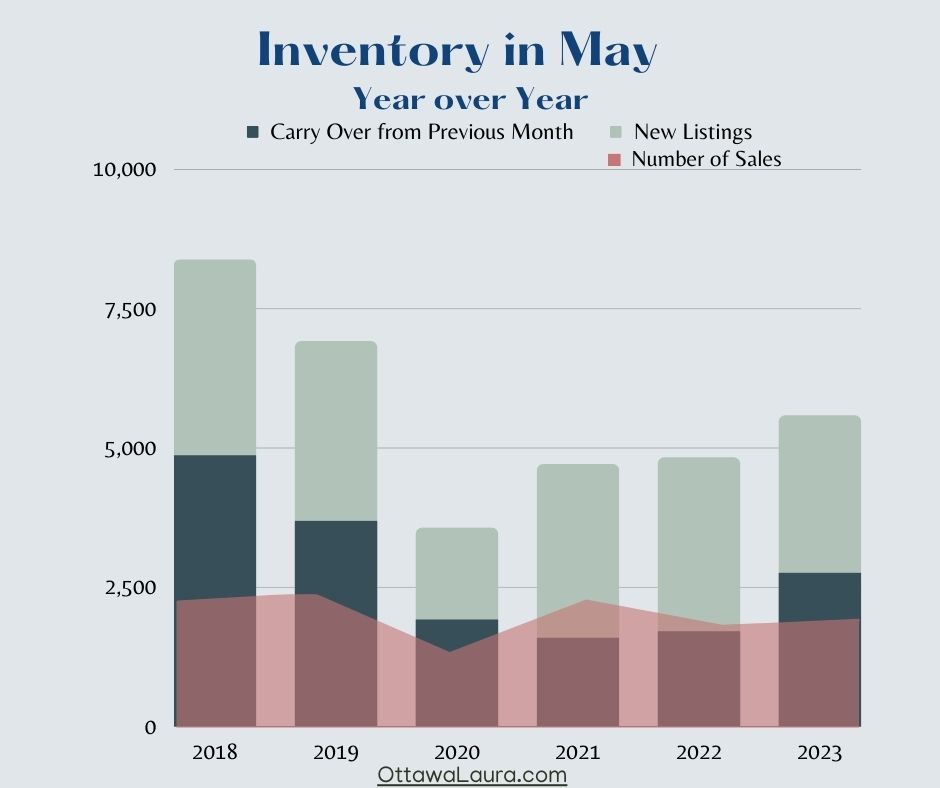
We have about 1000 fewer properties available for buyers than we did in May of 2019
Are you curious how these monthly stats affect your situation? It’s all part of our hyper-local and individualized approach. As a Buyer or Seller, reach out now to get:
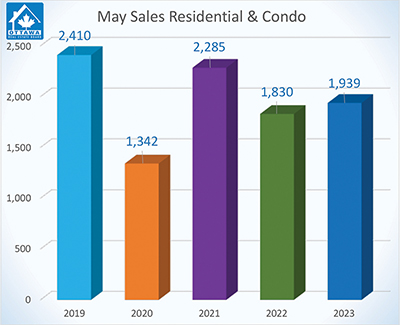
Sales increase for the first time since February 2022
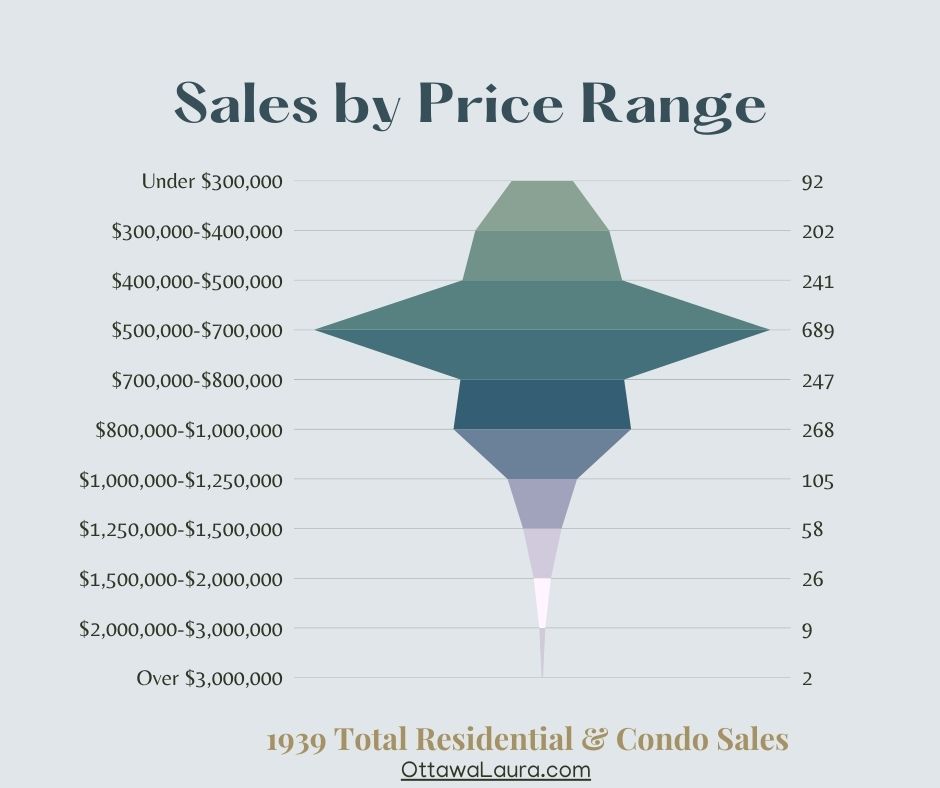
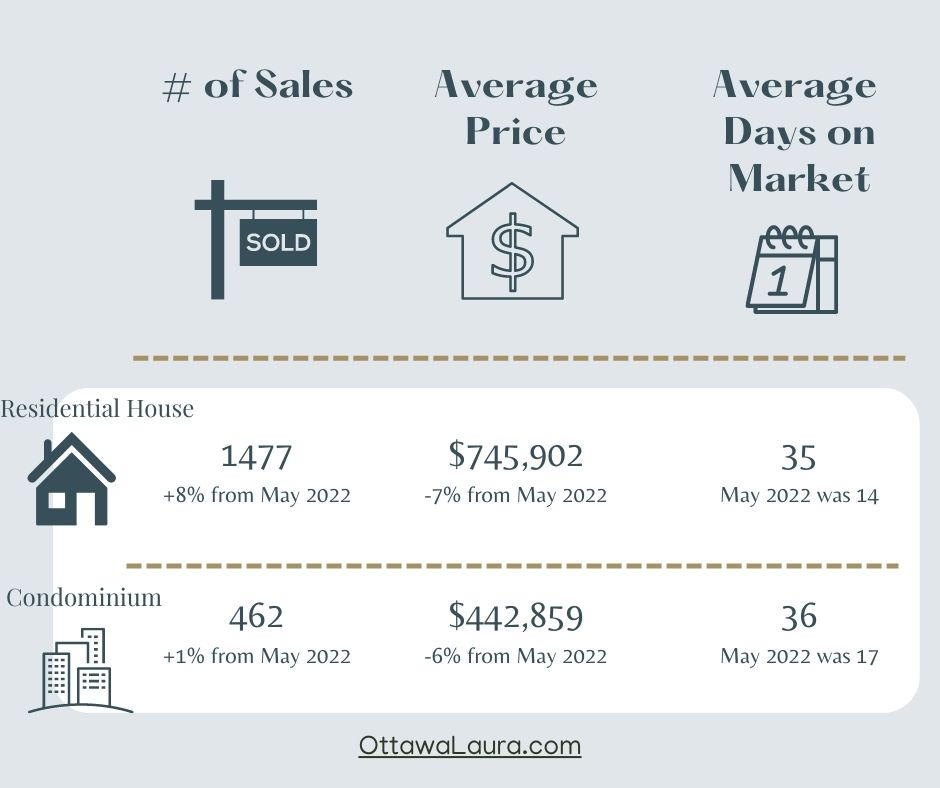
Members of the Ottawa Real Estate Board (OREB) sold 1,939 residential properties in May through the Board’s Multiple Listing Service® (MLS®) System, compared with 1,830 in May 2022, an increase of 6%. May’s sales included 1,477 in the freehold-property class, up 8% from a year ago, and 462 in the condominium-property category, a 1% increase from May 2022. The five-year average for total unit sales in May is 1,961.
“Typically the highest-selling month, May’s transactions did not disappoint,” says Ken Dekker, Ottawa Real Estate Board President. “This month we saw the first year-over-year unit sales volume increase since February 2022. It is a promising year for sellers barring any interest rate adjustments, as we saw a correlated drop in sales every time there was an interest rate hike in 2022.”
 |
“However, with only five to six weeks of inventory, we are in a strong seller’s market. With the pent-up high demand and sales volume increasing, we are likely to see upward pressure on prices as demand continues to outstrip supply.”
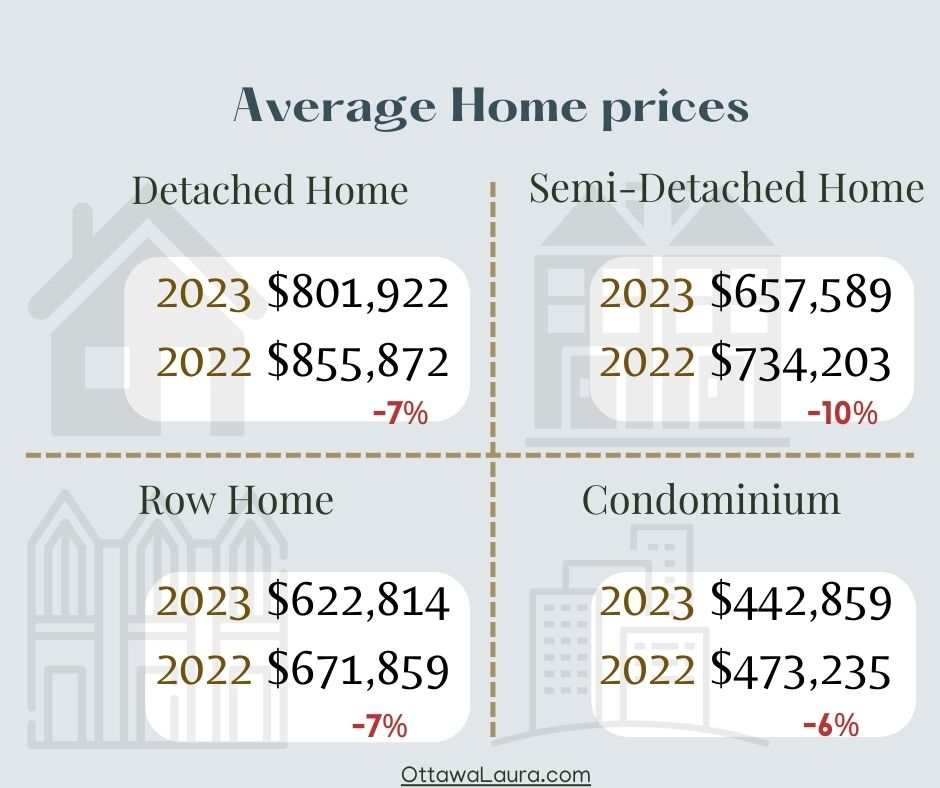
By the Numbers – Average Prices*:
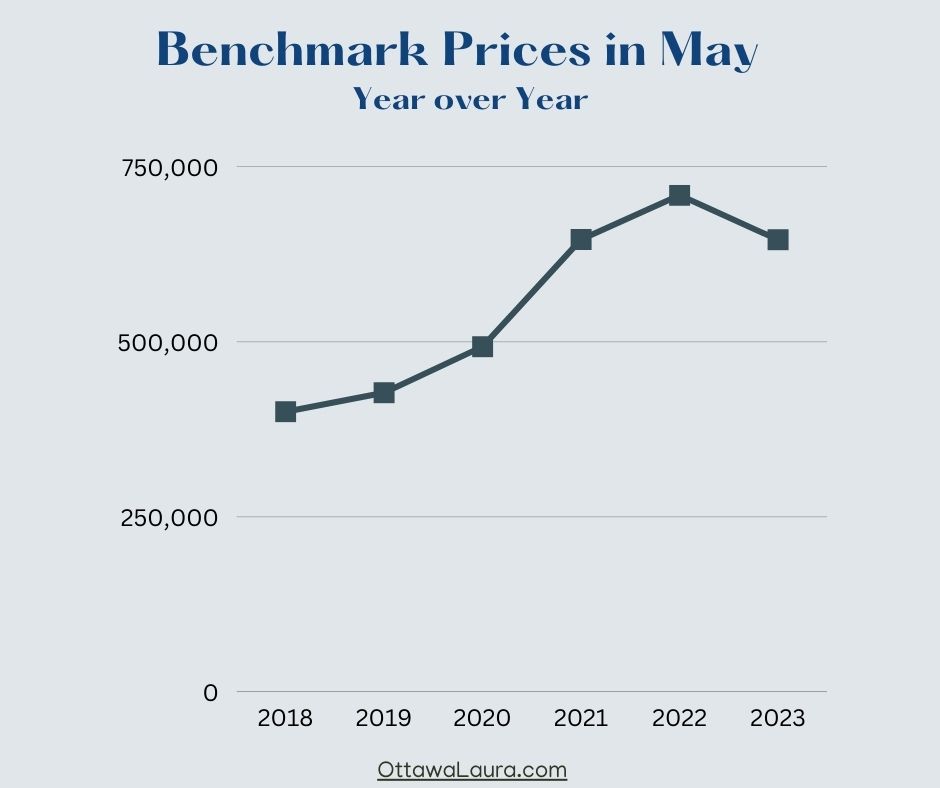
- The average sale price for a freehold-class property in May was $745,902, a decrease of 7% from 2022, but still on par with April 2023 prices.
- The average sale price for a condominium-class property was $442,859, decreasing 6% from a year ago. However, it marks a 2% increase over April 2023 prices.
- With year-to-date average sale prices at $727,728 for freeholds and $428,394 for condos, these values represent a 12% decrease over 2022 for freehold-class properties and a 9% decrease for condominium-class properties.
“We are not seeing steep price escalations yet. May’s average prices stayed on par with April’s, although prices are well over what we saw at the end of 2022. With demand mounting in Ottawa’s chronically undersupplied market, I expect the average sale price will surpass last year’s figures for a month over the same month in the latter half of 2023 again—provided we do not see interest rate hikes.”
By the Numbers – Inventory & New Listings:
- May’s new listings (2,822) were 9% lower than May 2022 (3,117) and up 32% from April 2023 (2,140). The 5-year average for new listings in May is 2,922.
- Months of Inventory for the freehold-class properties has increased to 1.5 months from 1.2 months in May 2022 but down from 1.9 months in April 2023.
- Months of Inventory for condominium-class properties has increased to 1.3 months from 1 month in May 2022, although down from 1.9 months in April 2023.
- Days on market (DOM) for freeholds decreased from 27 to 23 days and 33 to 26 days for condos compared to last month.
“Given our housing stock challenges, some neighbourhoods are again in multiple offer territory. REALTORS® have up-to-the-minute market data and are best positioned to help both buyers and sellers in this evolving competitive resale market.”
REALTORS® also help with finding rentals and vetting potential tenants. Since the beginning of the year, OREB Members have assisted clients with renting 2,731 properties compared to 2,230 last year at this time, an increase of 22%.