Ottawa Market Data, The Numbers
Price
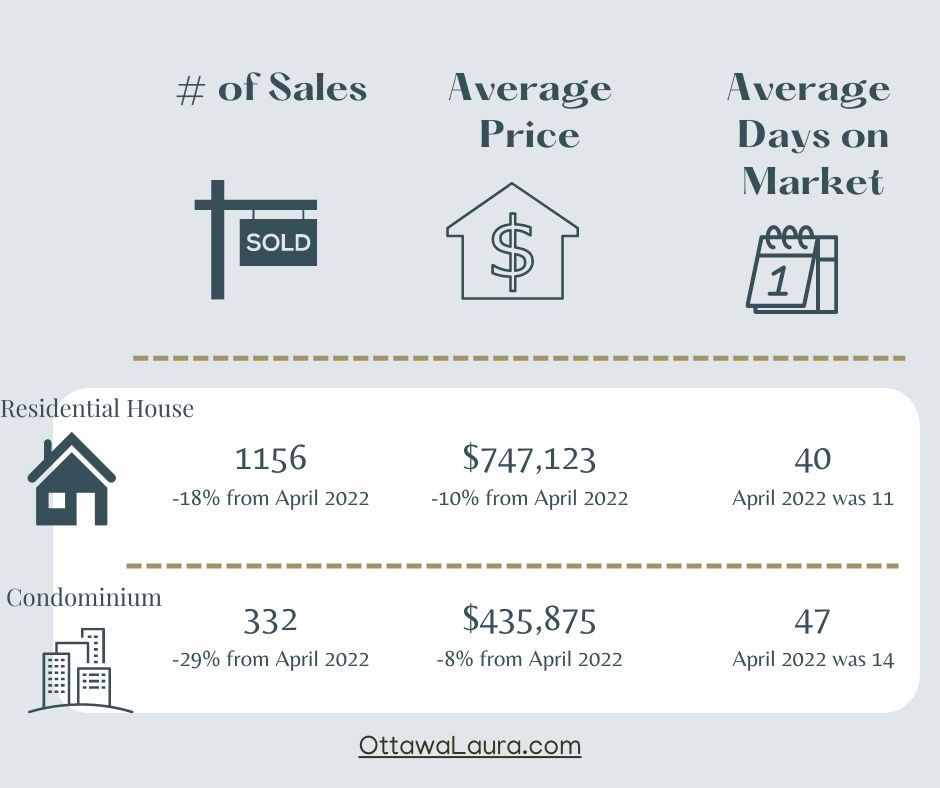
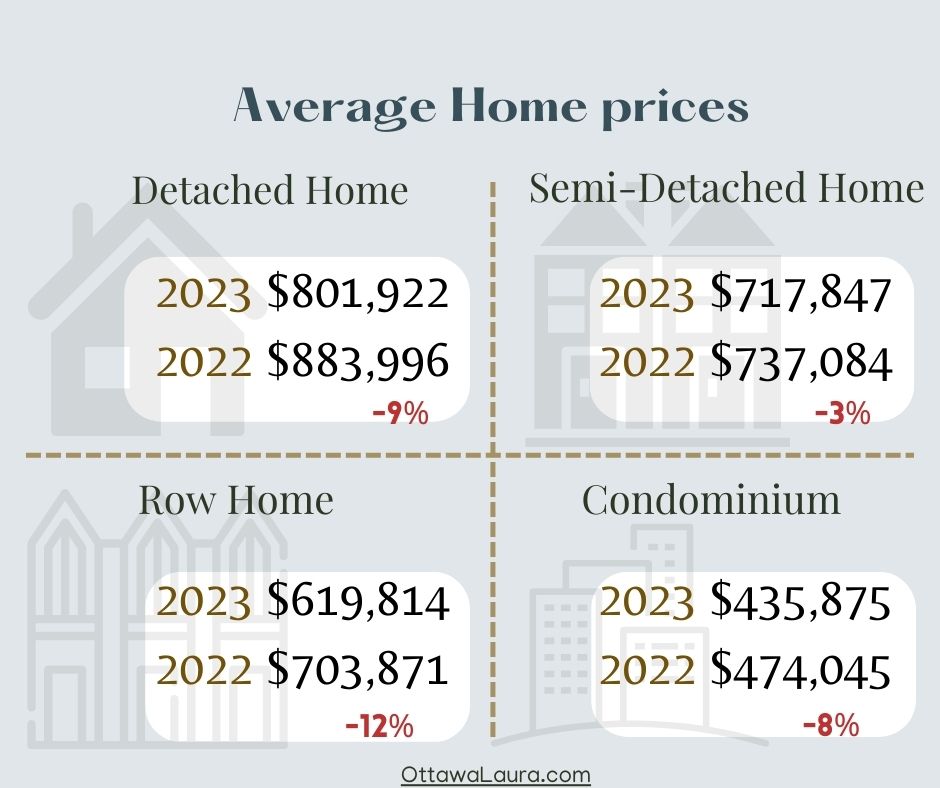
Residential Prices ⬇️ 10% from last year
Average Price: $747,123
Condominium Prices ⬇️8% from last year
Average Price: $435,875
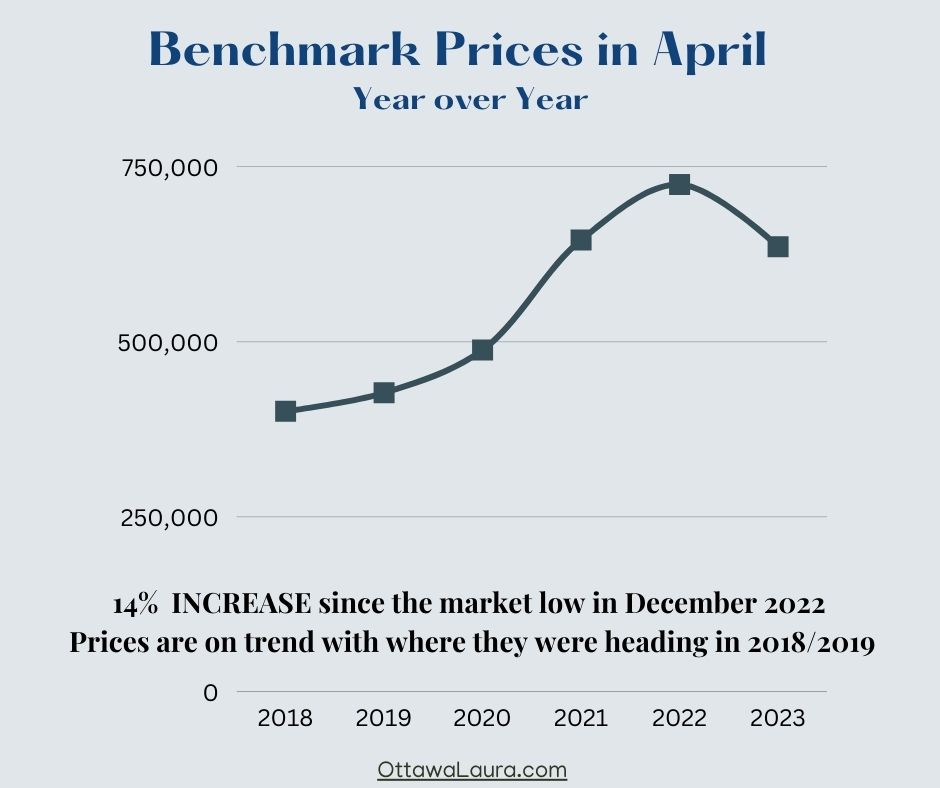
⬆️14% since December 2022
⬆️5% Freehold and 4% Condo increase since March 2023
Supply
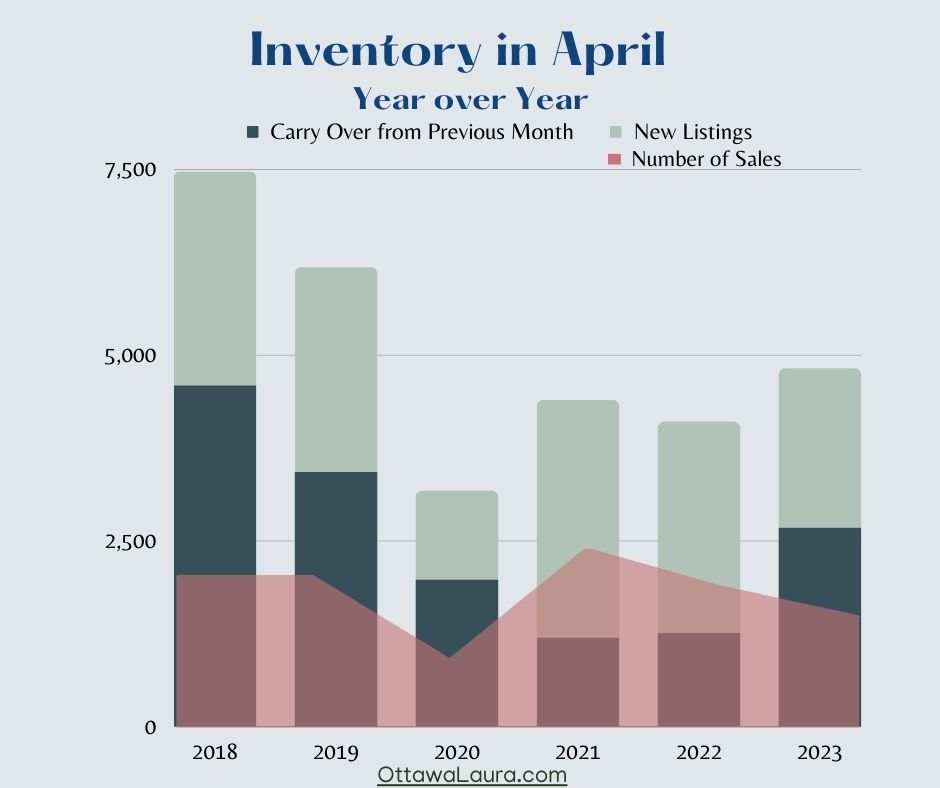
Total Inventory – ⬆️ & ⬇️
- April 2022 – 2843 properties were listed
- April 2023 – 2144 properties were listed
*5 Year average is 2575
Last April was the first time we started to see the number of sales start to slow, however it was still pretty aggressive with less than one month of inventory.
While we had MORE inventory than last April, this year we observed the opposite trend. With around 700 fewer properties coming to market in 2023 over 2022, the months of inventory continue to decrease. This means that if no new properties are listed Ottawa would be be sold out in 55 days.
2023 Inventory Trends
- January 2023 – 3.8 months
- February 2023- 2.74
- March 2023 – 2.24
- April 2023 – 1.79
*Seller Market = less than 4 months of Inventory
Balanced Market = 4-6 months of inventory
Buyers market = 6+ months of Inventory
Demand
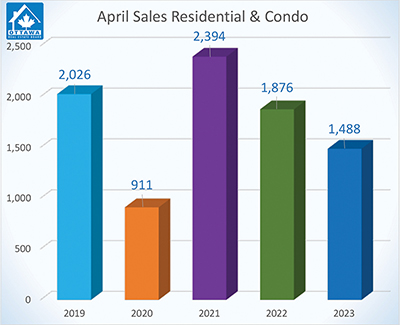
Total # of Sales – ⬆️ & ⬇️
The five-year average number of sales is 1739.
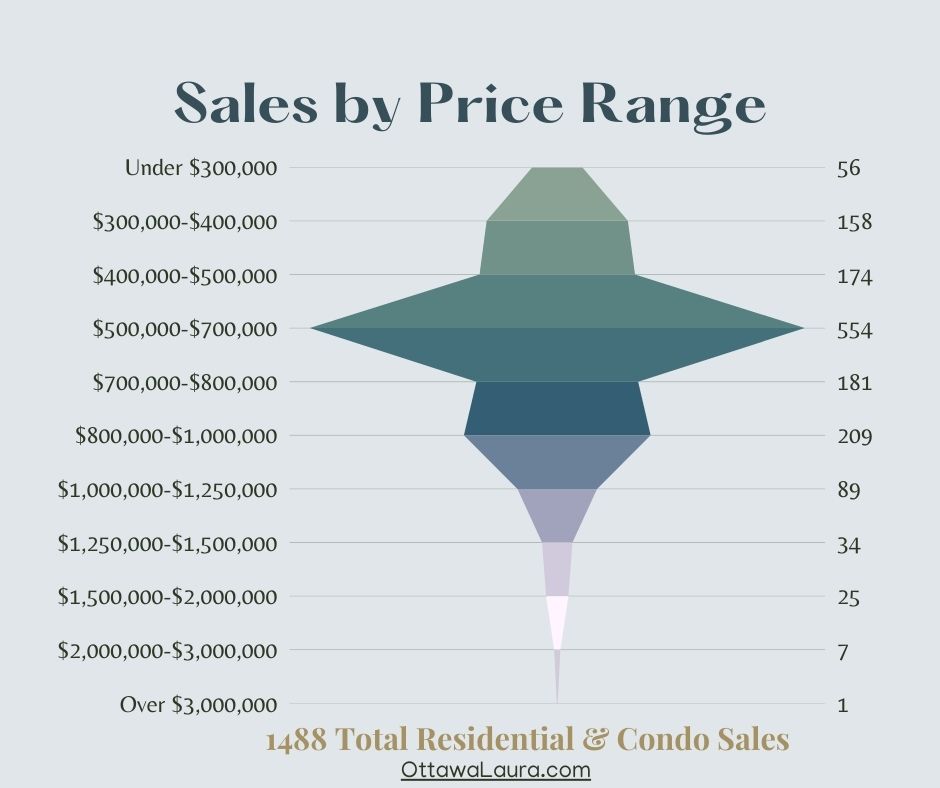
We had 1488 sales, so with about 300 fewer sales than we normally see and about 700 fewer properties on the market, the simple rules of supply vs. demand is putting pressure on the sale prices. The housing stock is getting absorbed in the buyer demand quickly.
After the intense peak of 2022, we are back to the pre-pandemic trends.
We don’t have enough properties. The federal government has strong immigration targets, and new constructions is not keeping up with demand. We are seeing rising rents and the need for more rental properties.
While interest rates are not expected to decrease in the year 2023, there has been some relief in inflation. Economists are starting to say they do not expect rates to increase this year. I’m hearing from mortgage brokerages that new approvals are increasing.
Expect May to bring more sales, some increased inventory, and what feels like a pretty typical spring market.
If you have any questions, all you have to do is reach out!
Laura Seanor
Ottawa Realtor®
RE/MAX Hallmark® Realty Group🏠
________________
Ottawa 30-second Real estate market update
Do you have questions about what it takes to sell or buy in Ottawa, Canada, successfully? Fill in the contact form and let’s chat
OTTAWA, May 3, 2023 – Members of the Ottawa Real Estate Board (OREB) sold 1,488 residential properties in April through the Board’s Multiple Listing Service® (MLS®) System, compared with 1,876 in April 2022, a decrease of 21%. April’s sales included 1,156 in the freehold-property class, down 18% from a year ago, and 332 in the condominium-property category, a decrease of 29% from April 2022. The five-year average for total unit sales in April is 1,739.
“Ottawa’s resale market is on a steady upward trajectory, narrowing the comparison gap to peak pandemic activity in 2022. However, with new listings not keeping pace, the available housing stock is declining, and with less than two months of inventory — we’re back into seller’s market territory,” says Ottawa Real Estate Board President Ken Dekker.
 |
By the Numbers – Average Prices*:
- Average prices have increased by 13.9% in four months since the market low in December 2022.
- The average sale price for a freehold-class property in April was $747,123, a decrease of 10% from 2022. However, it marks a 5% increase over March 2023.
- The average sale price for a condominium-class property was $435,875, decreasing 8% from a year ago, but still a 4% gain over March 2023.
- With year-to-date average sale prices at $718,633 for freeholds and $421,722 for condos, these values represent a 13% decrease over 2022 for freehold-class properties and a 10% decrease for condominium-class properties.
“Upward pressure on sales prices continues with average prices increasing for the fourth month since the market low in December. Additionally, multiple offer situations have returned to certain neighbourhoods and overall days on market are maintaining their downward trend. There continues to be low inventory in certain property classes and new product is coming to the market at a slower rate, which is affecting supply.”
By the Numbers – Inventory & New Listings:
- April’s new listings (2,144) were 25% lower than April 2022 (2,843) and up 3% from March 2023 (2,089). The 5-year average for new listings in April is 2,575.
- Months of Inventory for the freehold-class properties has increased to 1.9 months from 0.9 months in April 2022 but down from 2.3 months in March.
- Months of Inventory for condominium-class properties has increased to 1.9 months from 0.8 months in April 2022, although down from 2.1 months in March.
- Days on market (DOM) for freeholds decreased from 34 to 27 days and 39 to 33 days for condos compared to last month.
“These numbers are static, snapshots in time. REALTORS® can give buyers and sellers a fulsome day-to-day picture of how the market is shifting and heating up this season. They have their fingers on the pulse of each neighbourhood in the city and can help buyers and sellers make localized, strategic, data-informed decisions.”
REALTORS® also help with finding rentals and vetting potential tenants. Since the beginning of the year, OREB Members have assisted clients with renting 2,151 properties compared to 1,786 last year at this time, an increase of 20%.
* OREB cautions that the average sale price can be useful in establishing trends over time but should not be used as an indicator that specific properties have increased or decreased in value. The calculation of the average sale price is based on the total dollar volume of all properties sold. Price will vary