Ottawa 30 second Real estate market update
PRICES:
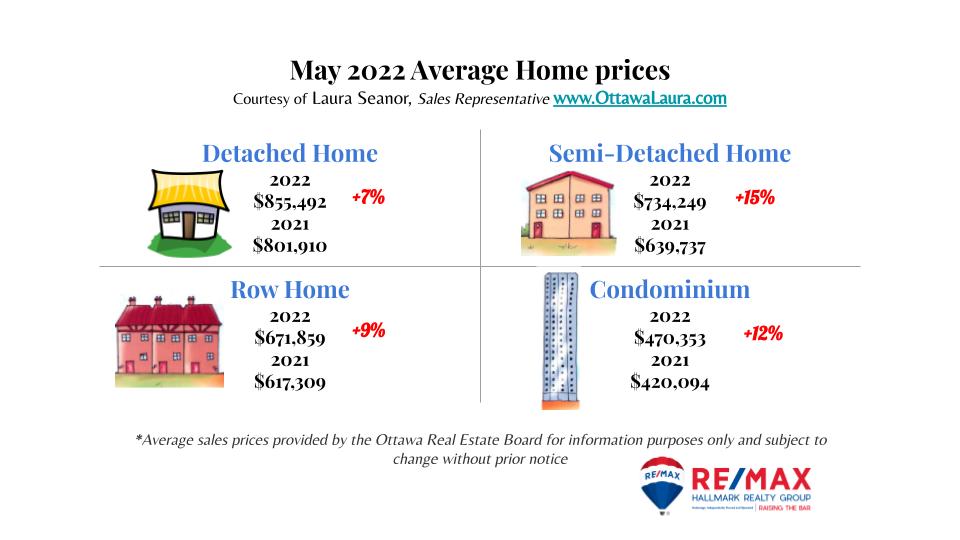
Detached Home Average: $855,492⬆️ 7%
Condo Average: $470,353 ⬆️12%
Semi-Detached Average: $734,249⬆️15%
Row Home Average: $671,859⬆️9%
SUPPLY:
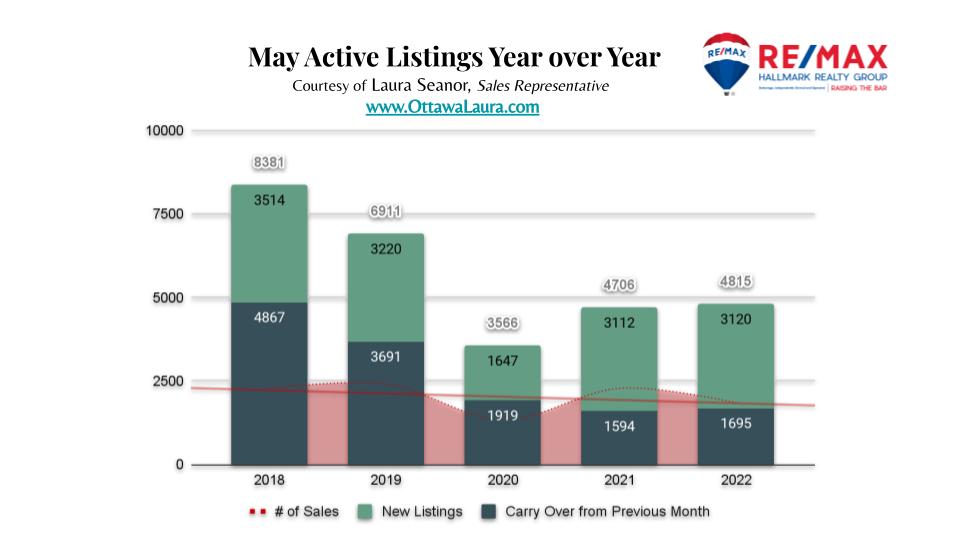
3120 new listings came to market this past month.
This is on par with the number of sales we usually see come onto the market in May
DEMAND:
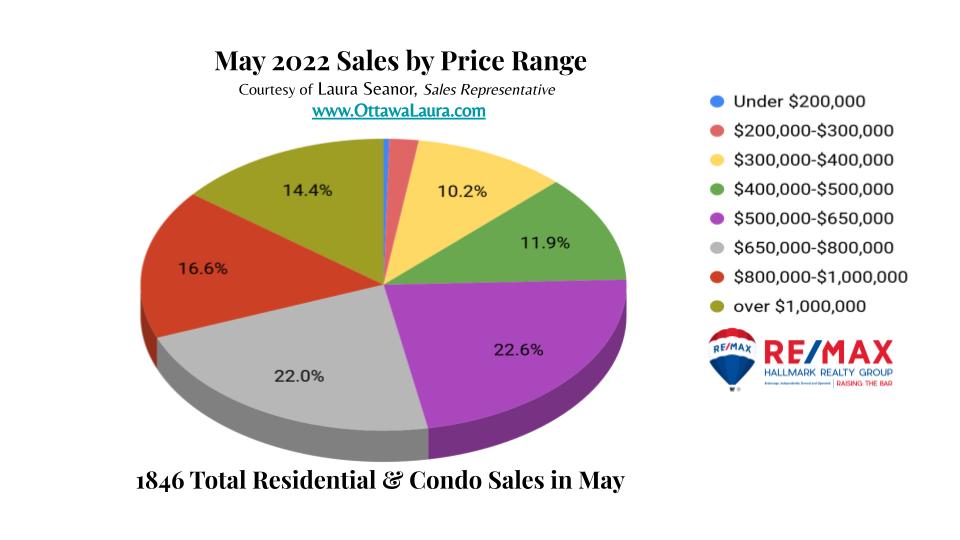
1846 residential properties sold in May.
This is slightly lower than the 5-year average. Traditionally April & May are very active sales in the real estate world. With the increased interest rates, we are actually seeing a downward trend in the number of sales.
- March 2011 Sales
- April 1889 Sales
43 fewer properties this past May than the April before.
ABSORPTION RATE
How quickly new properties are sold and absorbed into the market
- January 2022 – 48% absorption rate
- February 2022 – 55% absorption rate
- March 2022 – 55% absorption rate
- April 2022 – 46% absorption rate
- May 2022 – 39% absorption rate
This means that properties were not snapped up as quickly as they were in previous months. However, a 39% absorption rate is an indicator of a Seller’s market. It means that if no new properties came to market we would be sold out in just over one month.
We saw this trend start to happen about June 2021 until just after September.
What to expect this month?
At the very beginning of June, we had another increase to the interest rates. I believe this will slow the market even more..perhaps moving closer to 2 months of inventory. This means that sellers will have to expect that their homes may take longer to sell, possibly upwards of 30 days.
We have been here before. In the past, it was common for homes to take 90-120 days to sell in the past.
While the prices are softening from where they were in January & February of this year, they are still approx. 8% higher than this time last year.
Under 4 months of inventory = Sellers Market
4-6 months of inventory = Balanced Market
6+ months of Inventory = Buyers Market
Depending on your unique situation, the market strategies of moving out, listing low and having a number of buyers come through your property may no longer be the most effective to yield the seller the highest results.
Most likely we will move back towards traditional real estate, listing at market value and offer negotiations.
This is good news for those of you looking to get into the market.
Laura Seanor
RE/MAX Hallmark Realty Group🏡
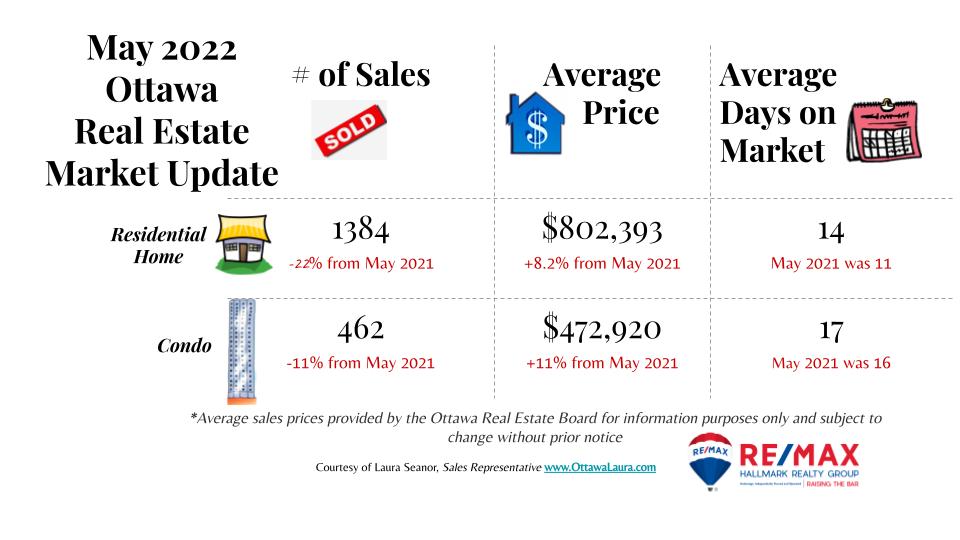
OTTAWA JUNE 3, 2022 -Members of the Ottawa Real Estate Board sold 1,846 residential properties in May through the Board’s Multiple Listing Service® System, compared with 2,285 in May 2021, a decrease of 19 per cent. May’s sales included 1,384 in the residential-property class, down 22 per cent from a year ago, and 462 in the condominium-property category, a decrease of 11 per cent from May 2021. The five-year average for total unit sales in May is 2,031.
“With year-over-year resales declining in March and April, and now with this downward trend continuing into May, traditionally the highest performing month for resales, it is quite clear that Ottawa’s resale market is shifting away from the blazing pace of 2021,” states Ottawa Real Estate Board President Penny Torontow. “And if rising interest rates, cost of living, and inflation aren’t enough factors to cause a pullback, the powerful and deadly storm that brought our city to its knees last month has justifiably impacted the market as well.”
“Our data shows a sharp decline in new listings with a corresponding increase in cancelled/suspended listings on the MLS® System in the period following the storm. Overall, in May, however, there were 3,120 properties that entered the market. This is on par with last May and is 5% over the 5-year average. The result is an 18% increase in residential-class inventory. Meanwhile, there was a slight decline (0.4%) in condominium inventory, but this is not surprising since they have likely become an entry point for many first-time homebuyers due to the affordable price point.”
The average sale price for a condominium-class property in May was $472,920, an increase of 11 per cent from 2021, while the average sale price for a residential-class property was $802,393, increasing 8 per cent from a year ago. With year-to-date average sale prices at $824,276 for residential and $470,353 for condominiums, these values represent a 12 per cent increase over 2021 for both property classes.*
“Average prices, while still higher than 2021, are showing signs of adjusting to the pace of the market with a month-over-month decrease of 2% in both property classes. In April, we also saw a decline of 1-3%. In contrast, January to March experienced month-to-month increases ranging from 2% to 12%. This may be good news for Buyers, including the fact that the months of inventory have increased to 1.2 for residential and 1 month for condominiums. We are still a far cry away from a balanced market, but it finally seems to be moving in the right direction,” Torontow suggests.
“Additionally, another statistic that we see increasing is the cumulative days on market (CDOM), which is now 14 days, increasing from 11 days last May. CDOMs are typically between 30-60 days in a balanced market, and usually closer to that one-month mark in Ottawa. I mention this because we don’t want Sellers to panic if their homes aren’t selling as quickly as perhaps their neighbours’ properties did. Buyers will also have a little more breathing room if this trend continues.”
“But at the end of the day, each property for sale has its own hyper-local market factors (location, condition, other properties for sale in the same neighbourhood, etc.) that will affect the final sale price. If you want to know the most accurate price point to sell your home or what is the true market value of a home you are interested in, a licensed professional REALTOR® has the education and the experience with access to the most current market statistics and property information, to guide you into making the optimal decision for you and your budget.”
REALTORS® also help with finding rentals and vetting potential tenants. Since the beginning of the year, OREB Members assisted clients with renting 2,320 properties compared to 1,837 last year at this time.